
Debug Commands
The Debug Commands workspace lets you execute collector debug commands directly from LMDA Composer, including a comprehensive collector health check. Debug sessions persist while you switch between workspaces.
Opening Debug Commands
Section titled “Opening Debug Commands”| Method | Action |
|---|---|
| Welcome Screen | Click Debug Commands on the welcome screen |
| Keyboard Shortcut | Press Cmd+K, D to switch to the debug workspace |
| Actions Menu | Click Actions → Debug Commands in the toolbar |
Sessions open as tabs in the tab bar (like API Explorer). Each tab retains its command configuration, collector selection, and results until you close it.
Use the Context portal selector in the toolbar to choose which LogicMonitor portal to connect to — the same global portal used by API Explorer and script execution. Use Execute (or Rerun when viewing results) in the toolbar to run the selected command.
Debug Commands Interface
Section titled “Debug Commands Interface”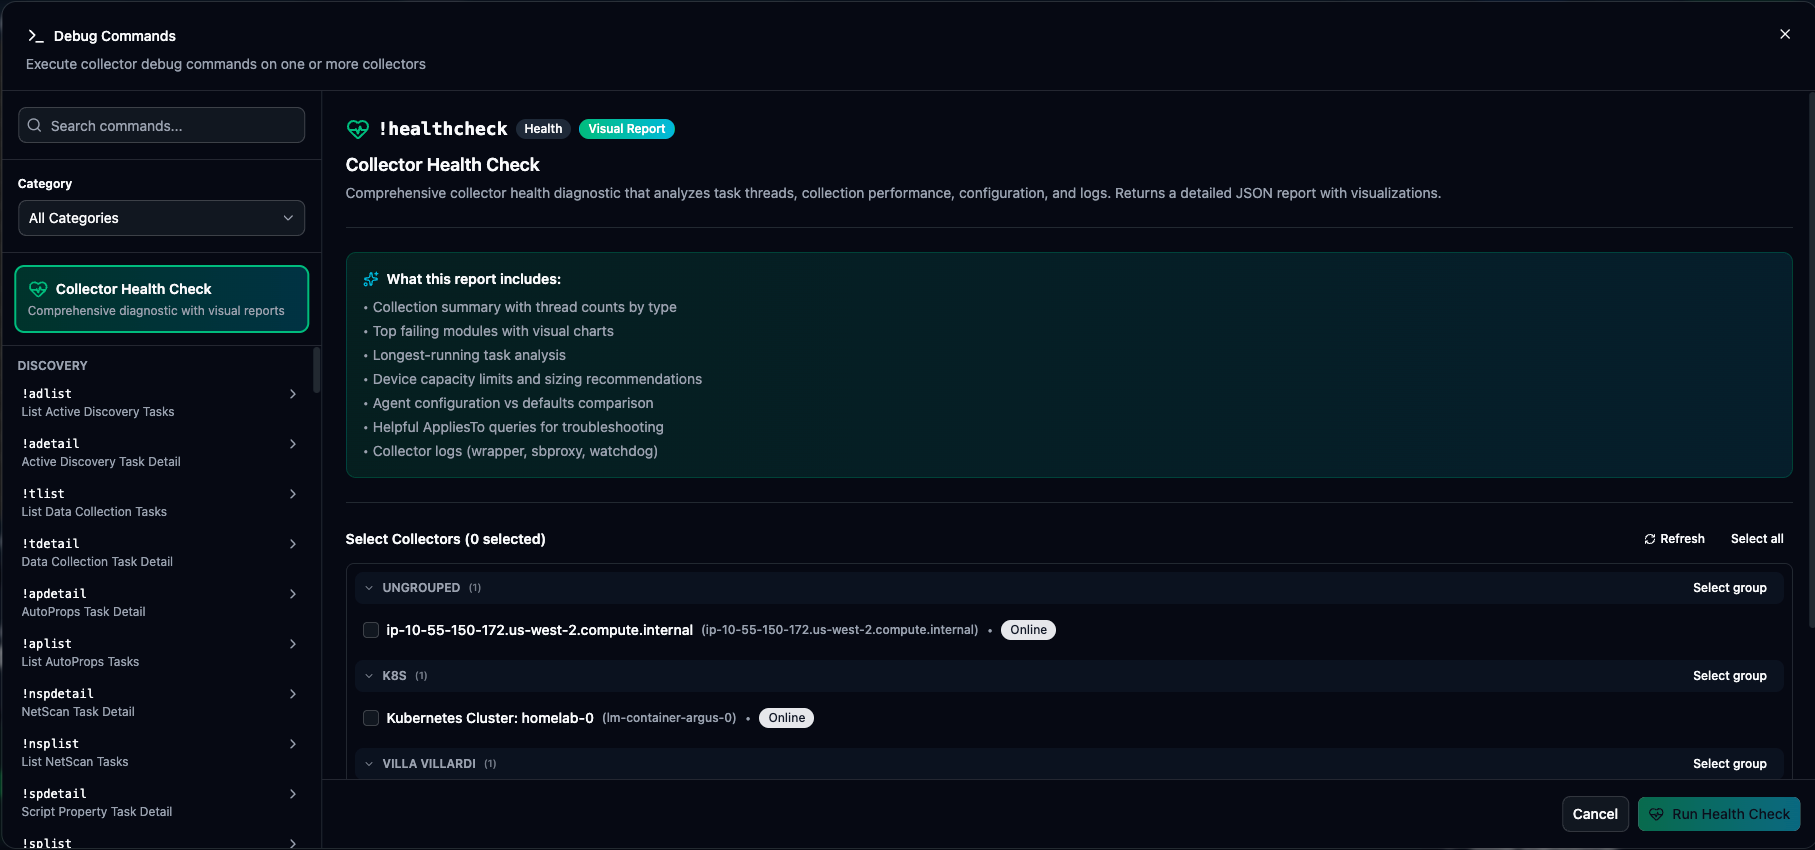
Command Search
Section titled “Command Search”Type in the search box to filter commands:
- Matches command names
- Matches descriptions
- Case-insensitive search
Category Filter
Section titled “Category Filter”| Category | Description |
|---|---|
| Discovery | Active Discovery and data collection task commands |
| System | Collector system info and configuration |
| Network | Network diagnostics and connectivity tests |
| Health | Health check and monitoring commands |
| Scripting | Script testing and execution |
| File Ops | File system operations |
| Diagnostics | Diagnostic and troubleshooting tools |
| Windows | Windows-specific commands (WMI, PowerShell) |
| Query | Protocol queries (SNMP, HTTP, etc.) |
| Task Mgmt | Task management and control |
Command List
Section titled “Command List”The filtered list shows:
- Command name
- Brief description
- Parameter indicators (if required)
Running Commands
Section titled “Running Commands”Selecting a Command
Section titled “Selecting a Command”-
Browse or search for a command
-
Click to select it—the command panel opens on the right
-
Fill in any required parameters
-
Select which collector(s) to run on
-
Click Run Command
Command Parameters
Section titled “Command Parameters”Some commands require input:
| Parameter Type | Input |
|---|---|
| Text | Free-form text input |
| Number | Numeric input |
| IP Address | IP address format |
| OID | SNMP OID format |
Selecting Collectors
Section titled “Selecting Collectors”Choose which collector(s) run the command:
- Scroll through collector groups
- Check individual collectors
- Or use Select All for a group
Multi-Collector Results
Section titled “Multi-Collector Results”When running on multiple collectors:
Results Tabs
Section titled “Results Tabs”Each collector gets its own tab showing:
- Collector name and status
- Execution duration
- Command output
Comparing Results
Section titled “Comparing Results”Switch between tabs to compare output across collectors. Useful for:
- Identifying configuration differences
- Comparing network connectivity
- Checking task loads
Exporting Results
Section titled “Exporting Results”For standard debug commands, click Export All to download a human-readable text bundle across all selected collectors. Use Copy Output or Download Output on an individual collector tab for that collector’s raw output.
Collector Health Check
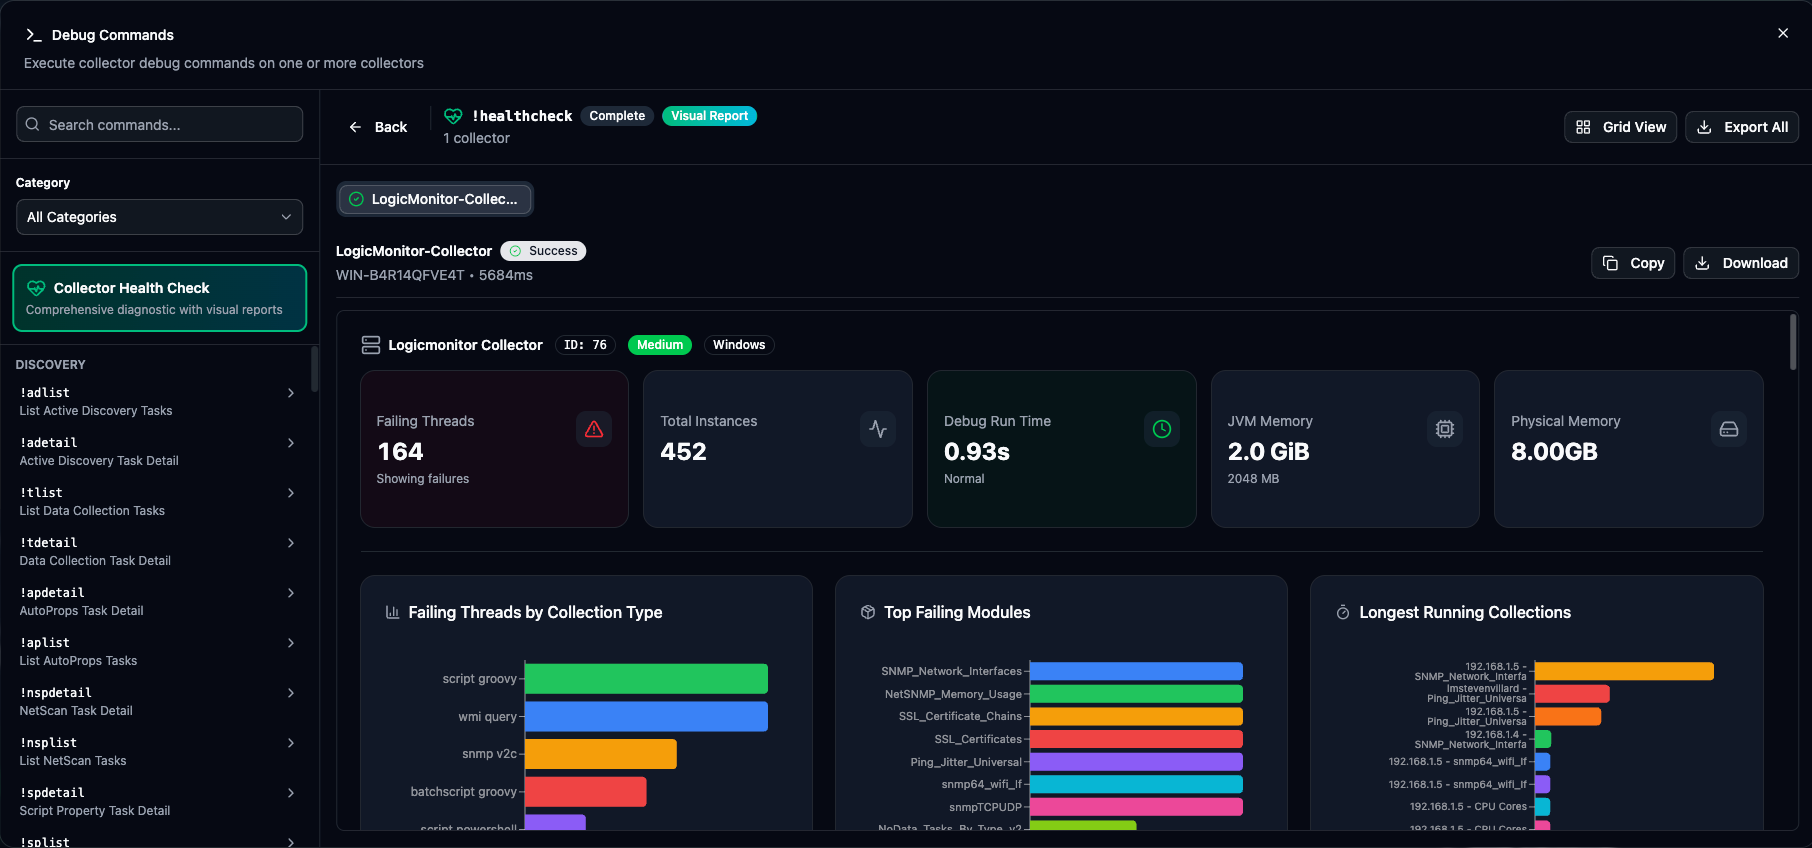
Section titled “Collector Health Check”The Health Check is a comprehensive diagnostic featured prominently at the top of the dialog. The report has been redesigned in v1.5.0 with modern styling and improved data visualization.
Running a Health Check
Section titled “Running a Health Check”-
Click the Health Check card at the top of the dialog
-
Select one or more collectors
-
Configure Report Options if needed (see below)
-
Click Run Health Check
-
Review the comprehensive report
Report Options
Section titled “Report Options”Before running a health check, you can configure how much data the report includes:
| Preset | Row limit | Use when |
|---|---|---|
| Standard | 50 rows | Default — fast reports on most collectors |
| Extended | 200 rows | Larger collectors needing more detail |
| Full | Unlimited | Complete lists, e.g. all longest-running tasks including negative-ms overflow and 0ms scheduled-failed entries |
Advanced options let you override limits per section (longest-running, task lists, host stats, etc.). Set a section limit to 0 for unlimited rows in that section only.
When data is truncated, the report shows “Showing N of M” badges on affected sections. The longest-running section includes a full scrollable table sorted with timer overflow (negative ms) first, longest durations in the middle, and 0ms entries at the bottom.
What It Checks
Section titled “What It Checks”- Collection Summary — Thread counts across all task types (tlist, adlist, splist, tplist, aplist)
- Top Failing Modules — Charts showing modules with the most failures
- Longest Running Tasks — Full scrollable table of failing tasks by execution time, plus a chart preview of the longest positive durations
- Device Capacity — Limits and current utilization
- Agent Config — Current configuration vs. defaults
- Collector Logs — Recent log entries and error patterns
Sharing and Importing Reports
Section titled “Sharing and Importing Reports”Use these actions to hand off a health check report to another Composer user without re-running the check on a collector:
| Action | Purpose |
|---|---|
| Export Report | Download a JSON file containing all collector results. This is the file to share with customers or teammates. |
| Import Report | Load a shared JSON report into Composer. Available from the Health Check card in the sidebar or from the results header. |
| Copy Output / Download Output | Human-readable text for a single collector (metadata headers plus output), useful for email or documentation. |
Imported reports display the full visual report UI even when the collectors are not present in your portal.
Health Check Report
Section titled “Health Check Report”The report displays:
Summary Cards:
- Collector info (ID, size, version, platform)
- Failing threads count (color-coded by severity)
- Total instances monitored
- Debug run time
- JVM and physical memory usage
Detailed Sections:
- Collection Summary — Thread breakdown by task type
- Top Failing Modules — Modules with the most failures
- Long Running Tasks — Tasks taking the longest time
- Host Stats — System resource statistics
- Tlist Summary — Task list summary with instance counts
- Agent Config — Current vs. default configuration comparison
- Capacity Limits — Device and instance limits
- Task Lists — Detailed task breakdowns (aplist, splist, adlist, tplist)
- Process List — Running processes with resource usage
- AppliesTo Queries — Troubleshooting expressions with inline testing
- Message Results — Top recurring messages and errors
- Logs Viewer — Recent collector log entries
AppliesTo Troubleshooting
Section titled “AppliesTo Troubleshooting”The Health Check report includes AppliesTo troubleshooting queries. These are pre-built expressions that help identify common issues. You can test these queries directly from the report using inline AppliesTo testing.
Interpreting Results
Section titled “Interpreting Results”The report uses color-coded indicators for quick assessment:
| Indicator | Meaning |
|---|---|
| Green | Healthy — no issues detected |
| Yellow | Warning — review recommended |
| Red | Error — action needed |
Failing Threads:
- 0 threads — Healthy (green)
- 1-9 threads — Warning (yellow)
- 10+ threads — Error (red)
Debug Run Time:
- < 5 seconds — Normal (green)
- 5-10 seconds — Elevated (yellow), check collector load
- > 10 seconds — High (red), collector may be overloaded
Common Debug Commands
Section titled “Common Debug Commands”| Command | Purpose |
|---|---|
!ping | Test connectivity to host |
!nslookup | DNS resolution test |
!traceroute | Network path trace |
!curl | HTTP request test |
| Command | Purpose |
|---|---|
!snmpget | Get single OID value |
!snmpwalk | Walk OID tree |
!snmptable | Retrieve SNMP table |
| Command | Purpose |
|---|---|
!wmi | Execute WMI query |
!posh | Run PowerShell command |
| Command | Purpose |
|---|---|
!tasklist | List running tasks |
!taskstop | Stop a specific task |
!tlist | Task list summary |
Example Workflows
Section titled “Example Workflows”Debugging SNMP Issues
Section titled “Debugging SNMP Issues”-
Open Debug Commands and select the target collector
-
Run
!pingto verify network connectivity to the device -
Run
!snmpgetwith the device IP and a test OID (like sysName) -
If
!snmpgetfails, check community string and SNMP version -
Run
!snmpwalkto see what OIDs are available
Checking Collector Performance
Section titled “Checking Collector Performance”-
Run Health Check on the collector
-
Review memory and CPU usage in the summary
-
Check task queue depths for backlog
-
Look for stuck or long-running tasks in the task list
-
Review error messages for recurring issues
Testing Network Paths
Section titled “Testing Network Paths”-
Run
!nslookupto verify DNS resolution -
Run
!pingto check basic connectivity -
Run
!traceroutefor detailed path analysis -
Identify network bottlenecks or routing issues
Output Formats
Section titled “Output Formats”Text Output
Section titled “Text Output”Most commands return plain text:
- Formatted for readability
- Line-by-line results
- Error messages highlighted in red
Structured Output
Section titled “Structured Output”Some commands (like Health Check) return structured data:
- Rendered as formatted tables
- Summary statistics
- Expandable sections
Error Output
Section titled “Error Output”Failed commands show:
- Error message
- Exit code (if applicable)
- Troubleshooting hints
Best Practices
Section titled “Best Practices”- Before Running — Verify correct collector(s) selected. Double-check parameter values. Consider impact on production collectors.
- Interpreting Results — Compare against known good baselines. Check timestamps for currency. Look for patterns across collectors.
- Documentation — Copy results for ticketing systems. Note collector and timestamp. Compare before/after for changes.