
API Explorer Overview
The API Explorer provides a built-in tool for exploring, testing, and learning the LogicMonitor REST API—without needing API tokens or external tools.
What Is the API Explorer?
Section titled “What Is the API Explorer?”| Feature | Description |
|---|---|
| Session Auth | Uses your active LogicMonitor session—no API tokens needed |
| Endpoint Catalog | Browse all available API endpoints organized by category |
| Request Builder | Build and execute requests with guided parameter input |
| Safety Controls | Confirm destructive requests and optionally restrict the explorer to GET requests |
| Request History | Review past requests and reload them for quick retesting |
Opening the API Explorer
Section titled “Opening the API Explorer”| Method | Action |
|---|---|
| Welcome Screen | Click API Explorer on the welcome screen |
| Command Palette | Press Ctrl+K and type “API” |
| New Tab | Click + and select New API Request |
| Keyboard | Press Cmd+K, M to toggle to API view |
API Explorer Layout
Section titled “API Explorer Layout”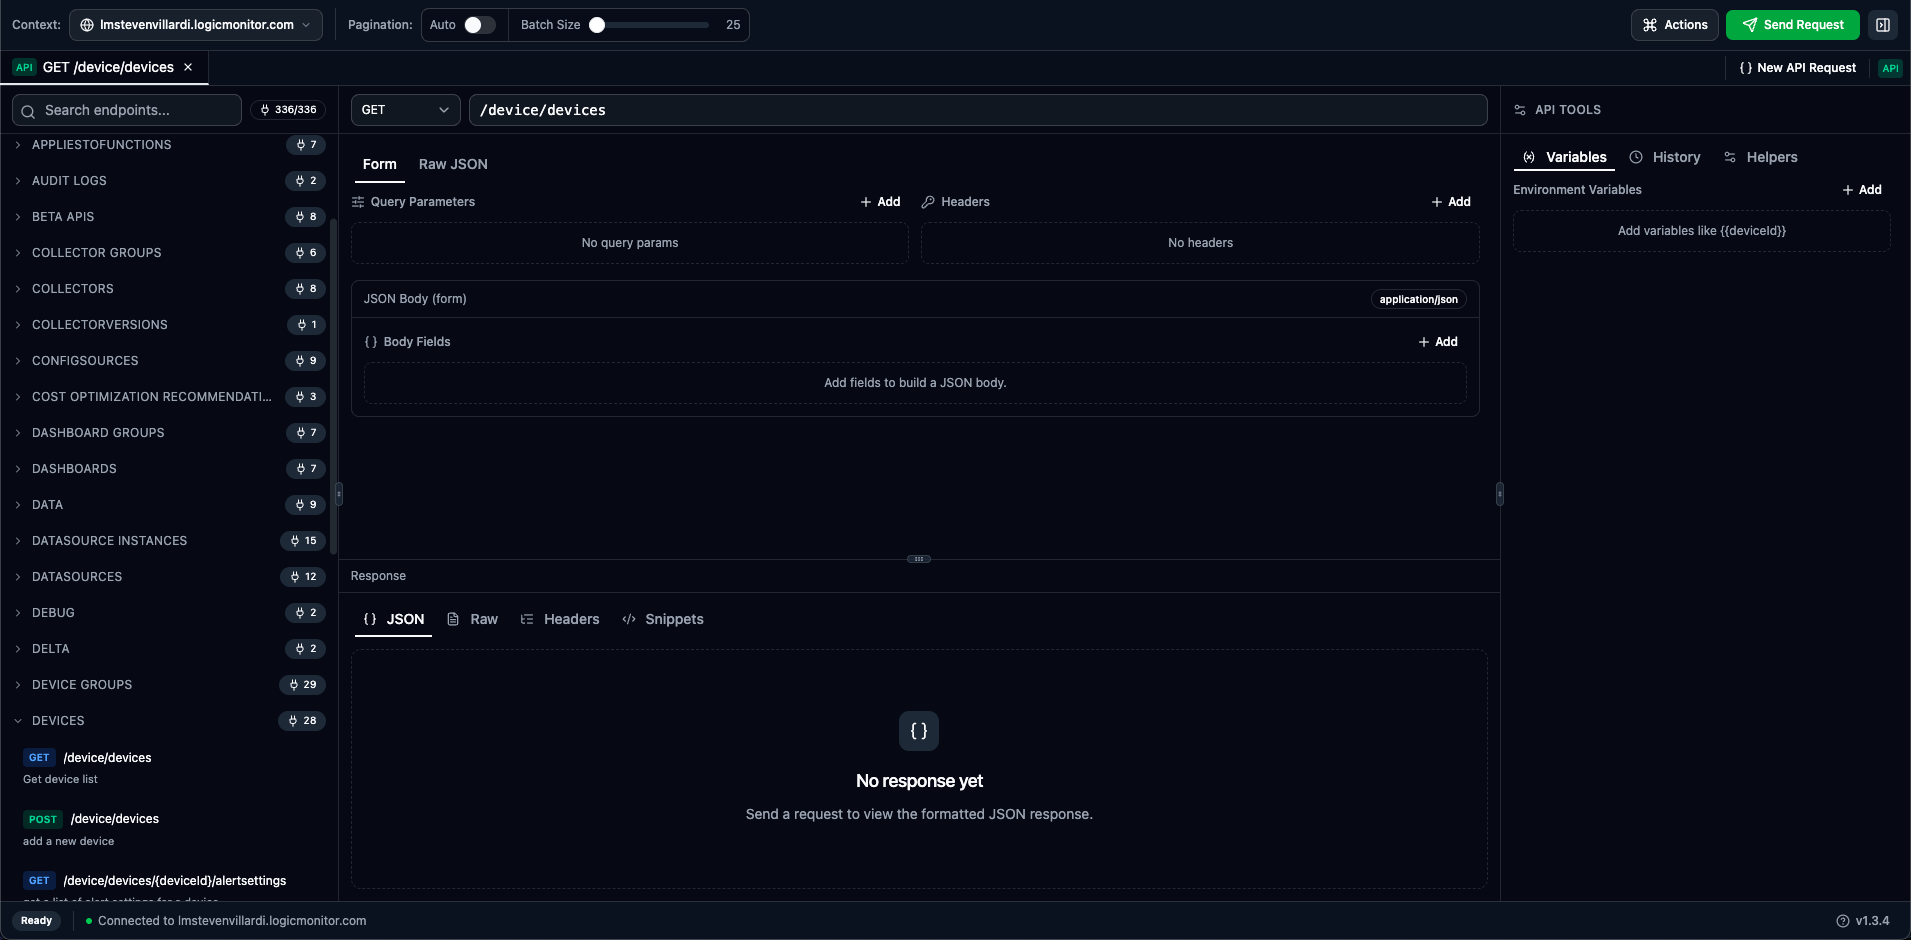
Main Panels
Section titled “Main Panels”| Panel | Description |
|---|---|
| Endpoint Catalog (left) | Browse and search all available API endpoints by category |
| Request Builder (center) | Method selector, endpoint path, query params, headers, and body |
| Response Viewer (center-bottom) | Formatted API response with multiple view modes |
| Tools Sidebar (right) | Docs, Variables, History, and Helpers tabs |
Tools Sidebar Tabs
Section titled “Tools Sidebar Tabs”The right sidebar provides four tabs. Docs appears first so endpoint details are visible before variables, history, or helpers have content.
| Tab | Description |
|---|---|
| Docs | View endpoint documentation with parameters, schemas, insert actions, and auto-generated examples |
| Variables | Manage reusable environment variables for substitution |
| History | View and reload past API requests |
| Helpers | JSON path helpers to save response values as variables |
Key Features
Section titled “Key Features”Session-Based Authentication
Section titled “Session-Based Authentication”Unlike traditional API tools, you don’t need API tokens:
-
Log into LogicMonitor in your browser
-
Open LMDA Composer—it uses your session cookie
-
All API calls execute with your permissions automatically
Endpoint Documentation
Section titled “Endpoint Documentation”The Docs tab in the sidebar provides comprehensive endpoint documentation:
- Path Parameters — Required path variables with type information and descriptions
- Query Parameters — Optional query parameters with enum values, constraints, and insert buttons
- Headers — Custom header parameters with insert buttons
- Request Body Schema — Nested property details with types, required indicators, constraints, insert buttons, and collapsible child fields
- Example Generation — Auto-generated example payloads based on the schema, prioritizing required fields
Select an endpoint from the catalog or enter a path to view its documentation automatically.
Endpoint Catalog
Section titled “Endpoint Catalog”The left panel lets you browse the complete LogicMonitor API:
- Organized by resource category (Devices, Alerts, Settings, etc.)
- Search across all endpoints by path, method, or description
- Click an endpoint to load it into the request builder
- See parameter requirements and example schemas
Request Building
Section titled “Request Building”Build requests with guidance:
- Method selector (GET, POST, PUT, PATCH, DELETE)
- Path autocomplete with endpoint suggestions
- Query parameter and header editors (Form mode)
- JSON body editor with syntax highlighting (Raw mode)
- Insert query parameters, headers, and body fields from the Docs tab
- Auto-generated request bodies include required fields first when the schema identifies them
Safety Controls
Section titled “Safety Controls”API Explorer includes guardrails for write operations:
- DELETE requests prompt for confirmation by default
- Use the API toolbar Confirm dropdown to switch confirmation between DELETE only, all write methods, or off
- The same confirmation setting is also available in Settings → API Explorer
- Read-only mode restricts endpoint selection and request execution to GET requests
- Read-only mode is available in Settings → API Explorer and from the API toolbar next to pagination controls
Disabled send, method, and endpoint controls include tooltips explaining what is blocking the action.
Response Viewer
Section titled “Response Viewer”Responses display in multiple formats:
| Tab | Content |
|---|---|
| JSON | Collapsible, syntax-highlighted JSON tree |
| Raw | Plain text response body |
| Headers | Response headers with copy functionality |
| Snippets | Generated code in cURL, Python, PowerShell, and Groovy |
API Tabs
Section titled “API Tabs”API requests open in tabs just like scripts:
| Indicator | Meaning |
|---|---|
| API | Tab contains an API request |
| • (dot) | Unsaved changes |
| Request name | Auto-generated from method and path (e.g., “GET /device/devices”) |
Work with multiple API requests simultaneously—each in its own tab. Compare responses side by side.
Supported Methods
Section titled “Supported Methods”| Method | Purpose |
|---|---|
| GET | Retrieve data from the API |
| POST | Create new resources |
| PUT | Replace/update entire resources |
| PATCH | Partial updates to resources |
| DELETE | Remove resources |
Quick Start Example
Section titled “Quick Start Example”Test your connection with a simple API call:
-
Open API Explorer
-
Method is GET (default)
-
Enter
/setting/versionas the endpoint -
Click Send Request
-
View the version response showing your portal’s API version
Permissions
Section titled “Permissions”API calls execute with your user permissions:
- Only see data you have access to
- Can only modify resources you can edit
- Admin endpoints require admin permissions
Rate Limiting
Section titled “Rate Limiting”LogicMonitor applies rate limits to API calls:
- Standard rate limits apply to all requests
- Response headers show remaining quota
- 429 Too Many Requests indicates rate limiting
The status bar shows response timing to help identify slow endpoints.
When to Use API Explorer
Section titled “When to Use API Explorer”- Learning the API — Explore endpoints interactively before writing automation code
- Quick Operations — Make one-off API calls without building full scripts
- Debugging — Test specific API calls to troubleshoot integration issues
- Data Export — Retrieve data for analysis, reporting, or migration