
Module Details Editor
The Module Details Editor allows you to view and modify metadata for module-bound tabs. Edit properties like name, description, AppliesTo expressions, and alert configurations.
Opening Module Details
Section titled “Opening Module Details”| Method | Action |
|---|---|
| Toolbar Button | Click the Module Details button in the main toolbar |
| Command Palette | Press Cmd+Shift+P and type “Module Details” |
Editor Layout
Section titled “Editor Layout”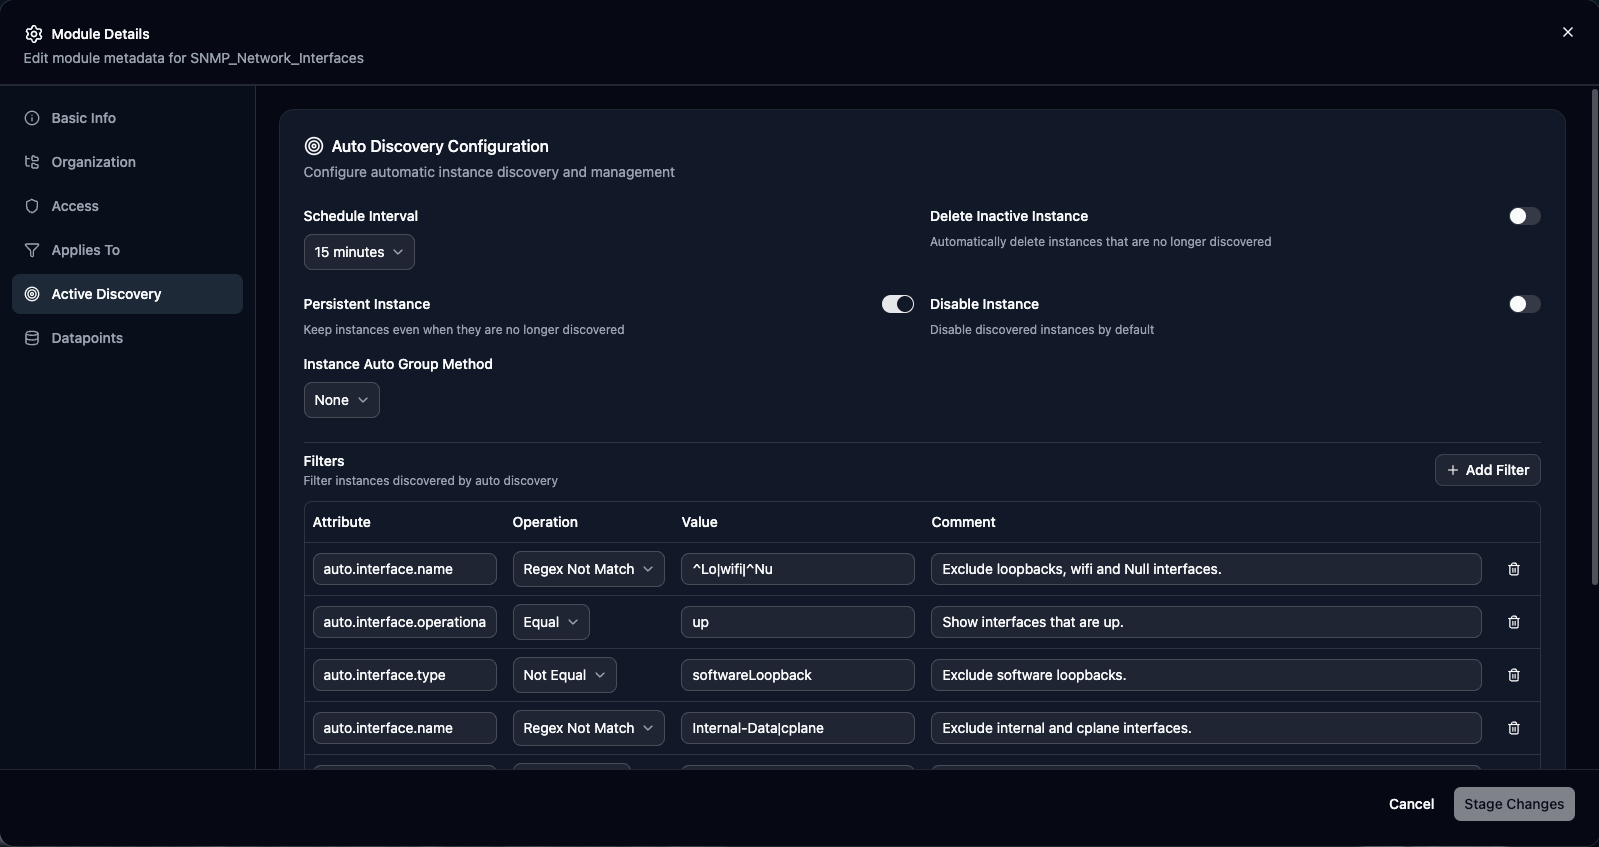
Sidebar Navigation
Section titled “Sidebar Navigation”The left sidebar contains section links. Sections vary by module type:
| Module Type | Available Sections |
|---|---|
| DataSource | Basic Info, Organization, Access, Applies To, Active Discovery, Datapoints |
| ConfigSource | Basic Info, Organization, Access, Applies To, Active Discovery, Config Checks |
| TopologySource | Basic Info, Organization, Access, Applies To |
| PropertySource | Basic Info, Organization, Access, Applies To |
| LogSource | Basic Info, Organization, Access, Applies To, Include Filters, Log Fields, Resource Mappings |
| EventSource | Basic Info, Organization, Access, Applies To, Alert Settings |
| DiagnosticSource | Basic Info, Organization, Access, Applies To |
Click a section to navigate. Dirty sections show an indicator dot. Invalid sections show a red error icon.
Common Sections
Section titled “Common Sections”Basic Info Section
Section titled “Basic Info Section”The internal identifier for the module:
- Must be unique within the portal
- Alphanumeric with underscores only
- Used in API references
- Maximum 255 characters
The human-readable name (DataSource/ConfigSource/EventSource only):
- Shown in the LogicMonitor UI
- Can include spaces and special characters
- Maximum 100 characters
Documentation for the module:
- Supports multi-line text
- Explain what the module monitors
- Include setup requirements
- Maximum 1000 characters
Read-only field showing:
- Current version number
- Last modified date
- Modified by user
Organization Section
Section titled “Organization Section”| Field | Description |
|---|---|
| Module Group | Organize modules into groups by selecting from existing groups |
| Tags | Add searchable tags as comma-separated values (e.g., custom, production, network) |
| Technology Type | Categorize by technology: Windows, Linux, Network, Cloud, or Custom |
| Collector Attribute | For modules requiring specific collector capabilities |
Access Section
Section titled “Access Section”| Field | Description |
|---|---|
| AppliesTo Expression | Define which resources use this module. Click Test to open the AppliesTo Toolbox |
| Group Restrictions | Select groups from dropdown. Multiple groups allowed. Leave empty for no restrictions |
| Collector Groups | Assign to specific collector groups for geo-specific monitoring |
Example AppliesTo Expression:
system.sysinfo =~ "Linux" && hasCategory("server")DataSource Sections
Section titled “DataSource Sections”Active Discovery Section
Section titled “Active Discovery Section”For modules with instance discovery:
| Setting | Description |
|---|---|
| Discovery Method | Script-based, SNMP, WMI, or None (single instance) |
| Discovery Interval | Range: 5 minutes to 24 hours. Balance freshness vs. performance |
| Instance Properties | Define auto-properties discovered for each instance |
| Filters | Post-discovery filtering with include/exclude patterns |
Datapoints Section
Section titled “Datapoints Section”Edit datapoints directly within LMDA Composer. The datapoints editor provides full CRUD operations for managing metric collection.
Datapoint Types
Section titled “Datapoint Types”Standard datapoints that collect metrics from script output:
- Source: Output key from collection script, exit code, or response time
- Metric Type: Gauge (current value), Counter (cumulative), or Derive (rate of change)
- Interpretation Method: How to transform the raw value (none, percent, bits to bytes, etc.)
Expression-based datapoints that derive values from other datapoints:
- Source: Expression using other datapoint names
- Metric Type: Always Gauge (calculated values)
- Syntax: Use datapoint names directly, e.g.,
UsedMemory / TotalMemory * 100
Datapoints Table
Section titled “Datapoints Table”The main datapoints table displays:
| Column | Description |
|---|---|
| Name | Unique datapoint identifier |
| Type | Metric type with icon (Gauge, Counter, Derive) |
| Method | Post-processor method (Expression, Name=Value, JSON Path, etc.) |
| Key / Expression | The extraction key or expression |
| Threshold | Color-coded severity badges with operator and values |
Click a row to expand and see additional details:
- Description (with line break support)
- Alert settings (No Data, Trigger, Clear intervals)
- Alert message subject and body
- Status display name translations
Adding Datapoints
Section titled “Adding Datapoints”-
Click the Add Datapoint dropdown button
-
Select Normal or Complex datapoint type
-
The editor sheet opens with type-appropriate options:
- For Normal: Configure source (output key, exit code, response time), metric type, and interpretation
- For Complex: Enter expression using other datapoint names
-
Configure alert thresholds if needed (Warning, Error, Critical)
-
Add optional description and alert message customizations
-
Click Save to add to the datapoints list
Editing Datapoints
Section titled “Editing Datapoints”Click the Edit (pencil) button on any datapoint row to open the editor sheet. All fields are editable:
| Section | Fields |
|---|---|
| Basic Settings | Name, description, source configuration, and metric type |
| Alert Thresholds | Warning, Error, and Critical thresholds with custom operators |
| Alert Messages | Custom subject and body templates with token support |
| No Data Handling | Alert level and intervals for missing data scenarios |
| Status Translations | Map numeric values to human-readable labels |
Removing Datapoints
Section titled “Removing Datapoints”-
Click the Delete (trash) button on the datapoint row
-
Confirm the deletion in the dialog
-
The datapoint is marked for removal (committed on next push)
Status Display Names
Section titled “Status Display Names”Translate numeric datapoint values to human-readable status strings in the LogicMonitor UI. Instead of displaying raw numbers like 0 or 1, show meaningful labels like “Offline” or “Online”.
Adding Status Translations:
-
Open the datapoint editor sheet
-
Scroll to the Status Display Names section
-
Click Add Translation
-
Configure:
- Operator: How to match the value (equals, greater than, less than, etc.)
- Value: The numeric threshold to match
- Display Name: The human-readable label to show (max 128 characters)
-
Add additional translations for other value ranges
-
Click Save to apply changes
Example Configuration:
| Operator | Value | Display Name |
|---|---|---|
| Equals | 0 | Offline |
| Equals | 1 | Online |
| Greater Than | 90 | Critical Load |
Alert Message Templates
Section titled “Alert Message Templates”Customize alert notifications with dynamic content using LogicMonitor tokens:
| Token | Description |
|---|---|
##DEVICE## | Device display name |
##INSTANCE## | Instance name |
##DATAPOINT## | Datapoint name |
##VALUE## | Current metric value |
##THRESHOLD## | Threshold that was crossed |
##LEVEL## | Alert severity level |
ConfigSource Sections
Section titled “ConfigSource Sections”Config Checks Section
Section titled “Config Checks Section”Config Checks define validation rules for configuration data collected by ConfigSources. Each check can trigger alerts based on configuration changes, missing values, or custom Groovy logic.
Config Check Types
Section titled “Config Check Types”Alerts on any configuration change with optional exclusions:
- Ignore regex patterns: Lines matching regex are excluded from diff
- Ignore lines starting with: Exclude lines with specific prefixes (e.g.,
#,//) - Ignore lines containing: Exclude lines with specific text
- Ignore blank lines: Skip blank line differences
- Ignore whitespace: Skip spacing changes
Multiple patterns can be added for regex, prefix, and contains exclusions.
Custom validation logic using Groovy:
- Access configuration via the
configvariable - Return
1to trigger alert,0for no alert - Full Groovy scripting capabilities
Alerts when the configuration cannot be collected:
- No additional options required
- Triggers on fetch failure
Alerts when a specific field is missing:
- Specify the variable/field name to check
- Triggers when the field is absent from config
Alerts on value changes or range violations:
- Value Changed: Alerts when the field value changes
- Value Range: Alerts when value is outside bounds (gt, lt, gte, lte, eq, ne operators)
Config Checks Table
Section titled “Config Checks Table”The main table displays:
| Column | Description |
|---|---|
| Name | Unique check identifier |
| Type | Check type with icon indicator |
| Alert | Color-coded severity badge (Warning/Error/Critical) |
| ACK Clear | Whether acknowledging clears the alert |
| Summary | Brief description of check configuration |
Click a row to expand and see:
- Description
- Auto-clear interval (if configured)
- Script content (for Groovy checks)
Adding Config Checks
Section titled “Adding Config Checks”-
Click the Add Check dropdown button
-
Select the check type:
- Any Change — Diff-based detection with exclusions
- Groovy Script — Custom validation logic
- Config Retrieval — Fetch failure detection
- Missing Field — Required field validation
- Value Check — Value change or range monitoring
-
The editor sheet opens with type-specific options
-
Configure:
- Name: Unique identifier for the check
- Description: Documentation text
- Alert Level: Warning, Error, or Critical
- Clear on Acknowledgement: Auto-clear when ACK’d
- Clear After: Minutes until auto-clear (0 = never)
-
Configure type-specific settings (patterns, script, variable, etc.)
-
Click Save to add to the config checks list
Editing Config Checks
Section titled “Editing Config Checks”Click the Edit (pencil) button on any row to open the editor sheet. All fields are editable:
| Section | Fields |
|---|---|
| Basic Settings | Name, description, and check type |
| Alert Configuration | Severity level, clear behavior, and intervals |
| Check Logic | Type-specific configuration (exclusions, scripts, variables) |
Removing Config Checks
Section titled “Removing Config Checks”-
Click the Delete (trash) button on the row
-
Confirm the deletion in the dialog
-
The check is marked for removal (committed on next push)
LogSource Sections
Section titled “LogSource Sections”LogSource modules have specialized sections instead of traditional scripts:
Include Filters Section
Section titled “Include Filters Section”Define filters to include or exclude log entries:
| Field | Description |
|---|---|
| Filter Name | Unique identifier for the filter |
| Filter Type | Include or Exclude |
| Match Pattern | Regex pattern to match log lines |
| Field | Which log field to apply the filter to |
Log Fields Section
Section titled “Log Fields Section”Define custom fields to extract from log entries:
| Field | Description |
|---|---|
| Field Name | The name of the extracted field |
| Extraction Method | Static value, Regex, or LM Property (Token) |
| Value/Pattern | The static value or extraction pattern |
Methods available:
- Static: Fixed value for all logs
- Dynamic (Regex): Extract using regular expression
- LM Property (Token): Use LogicMonitor device property
Resource Mappings Section
Section titled “Resource Mappings Section”Map log entries to LogicMonitor resources:
| Field | Description |
|---|---|
| Mapping Name | Unique identifier |
| Source Field | Log field to use for mapping |
| Target Property | LogicMonitor property to match against |
EventSource Sections
Section titled “EventSource Sections”Alert Settings Section
Section titled “Alert Settings Section”Configure alerting behavior for EventSource modules:
| Setting | Description |
|---|---|
| Alert Level | Default severity (Warning, Error, Critical) |
| Alert Subject | Template for alert notification subject |
| Alert Body | Template for alert notification body |
| Clear on ACK | Whether acknowledging clears the alert |
| Effective Interval | Time before alert re-triggers (in minutes) |
Making Changes
Section titled “Making Changes”Change Tracking
Section titled “Change Tracking”The editor tracks all modifications:
- Modified fields highlighted
- Section indicators show dirty state (dot icon)
- Invalid sections show error icon
- Undo available per field
Staging Changes
Section titled “Staging Changes”Changes are automatically staged when you modify fields. All changes are committed together when you push to the portal.
Resetting Changes
Section titled “Resetting Changes”Click Reset Changes to discard all modifications and revert to original values.
Validation
Section titled “Validation”Required Fields
Section titled “Required Fields”| Field | Required |
|---|---|
| Module Name | Yes |
| Display Name | DataSource/ConfigSource/EventSource |
| AppliesTo | Most types |
Character Limits
Section titled “Character Limits”| Field | Limit |
|---|---|
| Name | 255 characters |
| Display Name | 100 characters |
| Description | 1000 characters |
| AppliesTo | 2000 characters |