
Output Panel
The Output Panel displays results from script execution, with different views depending on the selected mode.
Panel Layout
Section titled “Panel Layout”The Output Panel sits below the code editor and includes:
- Tab selector for different output views
- Execution status badge showing run state
- Duration timer for execution time
- Controls for copy, fullscreen, and clear
Drag the divider between the editor and output panel to resize.
Output Tabs
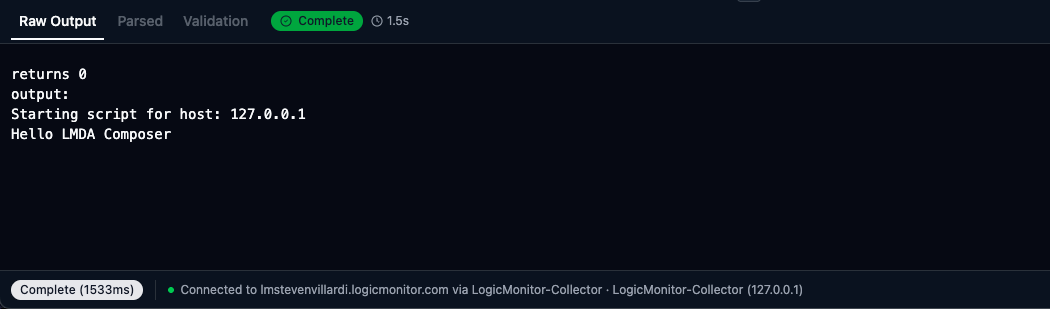
Section titled “Output Tabs”The complete text output from your script execution:
- Full stdout from the collector
- Includes warnings, errors, and debug messages
- Preserves formatting and line breaks
- Displayed in monospace font
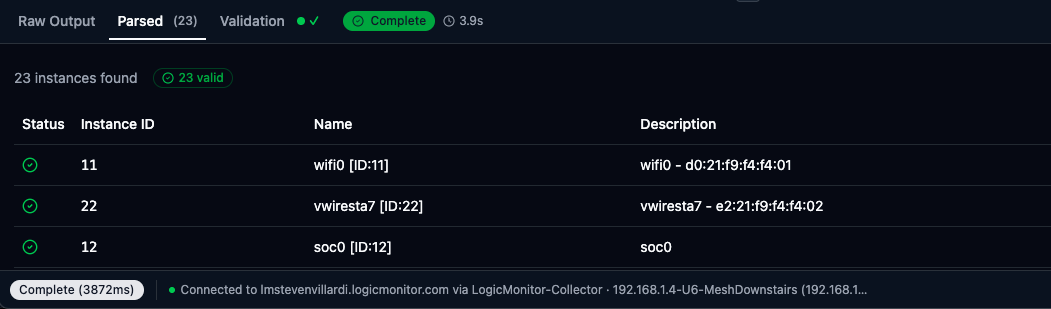
Structured view of output based on the current execution mode.
Active Discovery Mode:
| Column | Description |
|---|---|
| Instance ID | The unique identifier (wildvalue) |
| Instance Name | Display name for the instance |
| Description | Optional description text |
| Properties | Auto-properties as key=value pairs |
The header shows total count: “Parsed (15)” for 15 instances.
Collection Mode:
| Column | Description |
|---|---|
| Datapoint | The datapoint name |
| Value | The numeric value |
Batch Collection Mode:
| Column | Description |
|---|---|
| Instance | The wildvalue/instance ID |
| Datapoint | The datapoint name |
| Value | The numeric value |
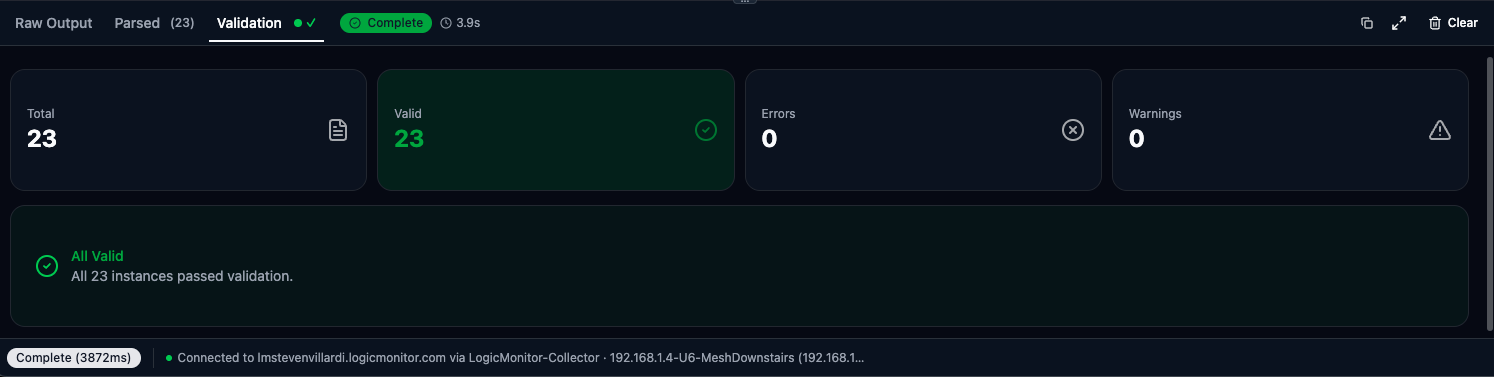
Real-time validation feedback based on the current mode’s output rules.
Status Indicators:
The tab header shows a summary: checkmark when valid, or warning/error counts.
For TopologySource scripts, displays an interactive network topology graph with full visualization capabilities.
Node Types:
| Type | Color | Description |
|---|---|---|
| Device | Blue | Vertices defined in your topology output |
| External | Gray | Resources referenced in edges but not in vertices |
Edge Type Colors:
| Type | Color |
|---|---|
| Network | Cyan |
| Bridge | Purple |
| CDP | Orange |
| LLDP | Green |
Interactive Features:
- Pan & Zoom — Use mouse wheel to zoom, drag to pan the canvas
- Node Selection — Click any node to view its details in the side panel
- Edge Selection — Click any edge to see connection info, health data, and metadata
- Details Panel — Collapsible side panel shows properties for selected elements
- Dynamic Legend — Shows only edge types and node types present in your topology
Node Details Panel:
- Node label and type
- Custom properties from your script
Edge Details Panel:
- Source and target connection
- Edge type and display type
- Instance information (from/to instances)
- Health DataSources with Tx/Rx datapoints
- Custom metadata
- Metric reporting node
Execution Status
Section titled “Execution Status”The status badge in the header shows the current state:
| Status | Description |
|---|---|
| Running | Script is executing (with spinner) |
| Complete | Finished successfully |
| Error | Script failed with an error |
| Timeout | Exceeded time limit |
| Cancelled | Execution was cancelled by user |
The execution duration displays next to the status badge (e.g., “2.34s”).
Validation Rules by Mode
Section titled “Validation Rules by Mode”| Issue | Severity | Description |
|---|---|---|
| Empty instance ID | Error | Instance ID is required |
| ID exceeds 1024 chars | Error | Maximum length exceeded |
| Invalid ID characters | Error | Contains spaces, =, :, \, or # |
| Name exceeds 255 chars | Warning | May be truncated |
| Duplicate instance ID | Warning | Same ID appears multiple times |
| Issue | Severity | Description |
|---|---|---|
| Invalid format | Error | Line doesn’t match key=value |
| Non-numeric value | Error | Value must be a number |
| Invalid datapoint name | Warning | Contains special characters |
| Missing wildvalue (Batch) | Error | Batch lines need instance.datapoint=value |
| Non-matching lines | Warning | Lines that don’t match expected format |
Error Display
Section titled “Error Display”When a script fails, the Raw Output tab shows:
Error messages appear in red text with stack traces and diagnostic information. Partial output may appear if the script produced output before failing.
Panel Controls
Section titled “Panel Controls”| Control | Action |
|---|---|
| Copy | Copy the entire raw output to your clipboard. Captures all content even if truncated in display. |
| Fullscreen | Expand the panel to fill the workspace. Press Esc or click ✕ to exit. |
| Clear | Reset the panel to empty state. Also clears automatically when starting a new execution. |
Best Practices
Section titled “Best Practices”Debugging with Output
Section titled “Debugging with Output”- Use
printlnstatements liberally during development - Print variable values and intermediate results
- Once logic is verified, format output for the target mode
Reading Validation Results
Section titled “Reading Validation Results”- Check the Validation tab after each run
- Fix all errors before deploying to production
- Address warnings when possible—they indicate potential issues
Working with Large Output
Section titled “Working with Large Output”- Use fullscreen mode for better readability
- The copy button captures all content, even if display is truncated
- Add summary lines at the end of your script for quick verification