
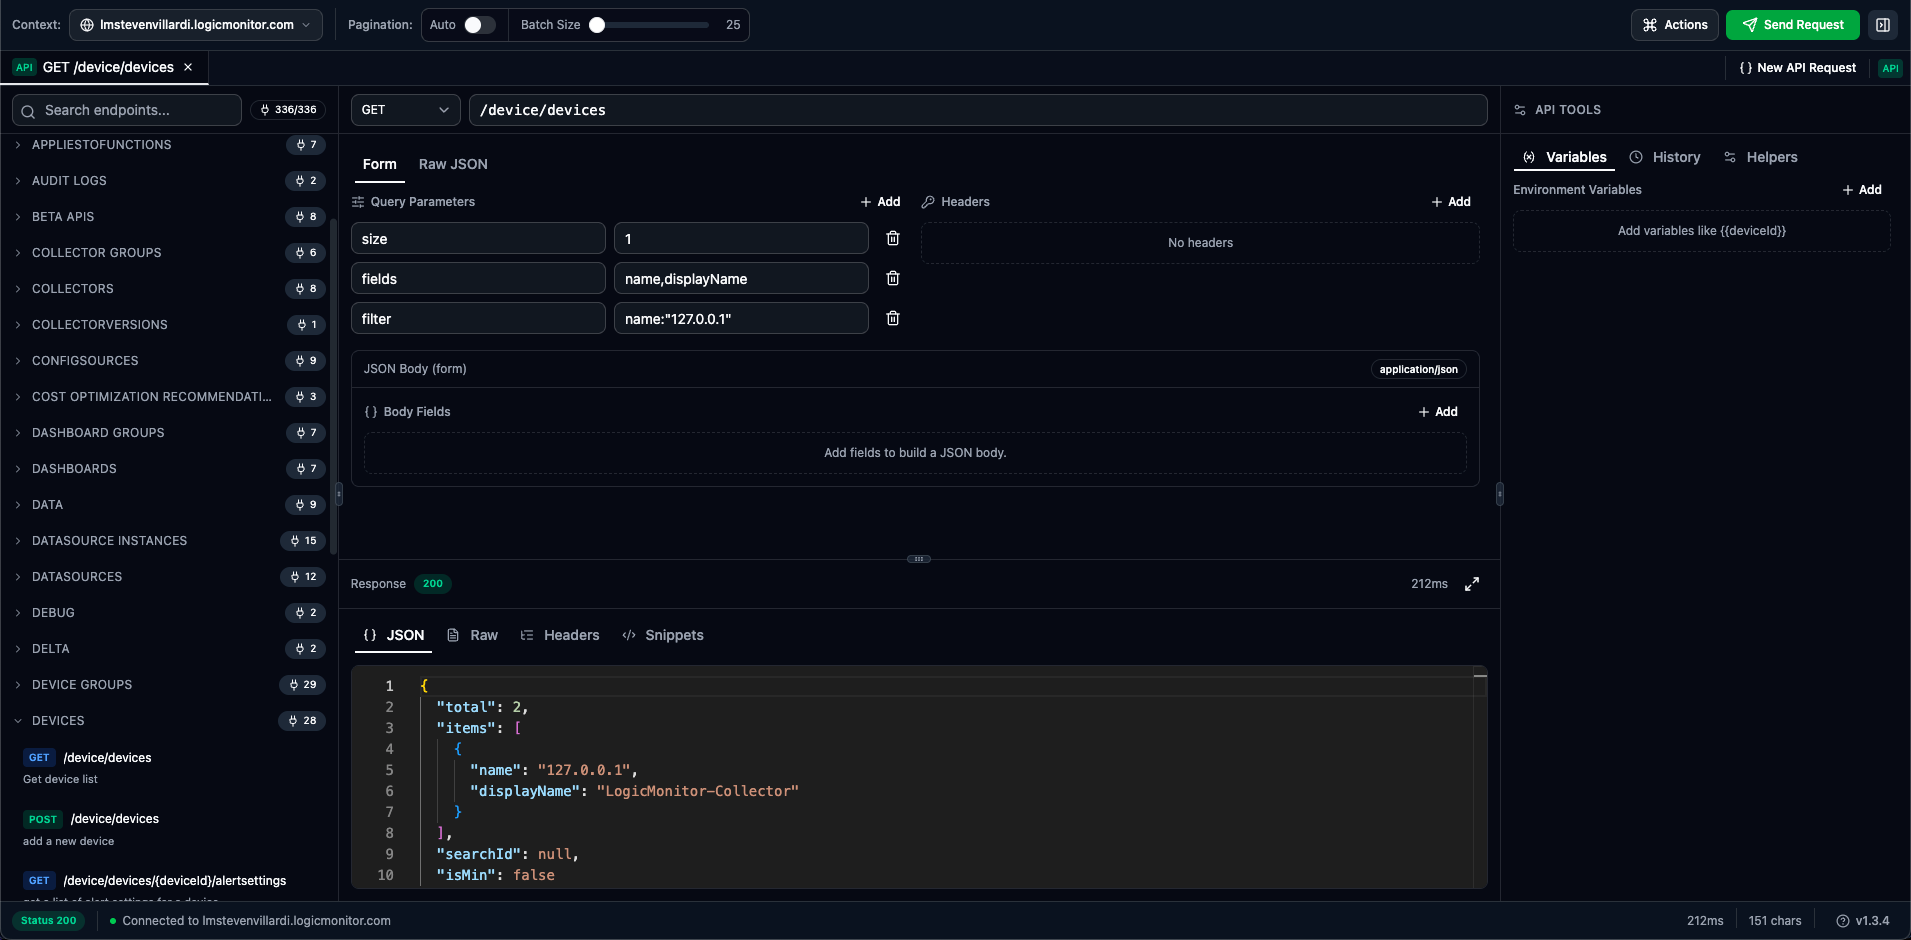
Request Builder
The Request Builder provides a structured interface for creating and executing LogicMonitor API requests.
Request Components
Section titled “Request Components”HTTP Method
Section titled “HTTP Method”Select the appropriate HTTP method from the dropdown:
| Method | Purpose | Has Body |
|---|---|---|
| GET | Retrieve data | No |
| POST | Create resources | Yes |
| PUT | Replace resources | Yes |
| PATCH | Update fields | Yes |
| DELETE | Remove resources | No |
Endpoint Path
Section titled “Endpoint Path”Enter the API endpoint path with autocomplete:
/device/devices/device/devices/{id}/setting/collectorsPath Parameters
Section titled “Path Parameters”Replace {id} placeholders with actual values:
/device/devices/123/setting/collectors/45/installersOr use variables for reusability:
/device/devices/{{deviceId}}The path field provides autocomplete suggestions from the endpoint catalog as you type.
Body Modes
Section titled “Body Modes”The request builder offers two modes for editing request content:
Form mode provides structured editors for:
| Section | Description |
|---|---|
| Query Parameters | Key-value pairs appended to the URL |
| Headers | Custom HTTP headers for the request |
| Body | JSON body as key-value form fields |
Parameters are automatically URL-encoded when sending. Toggle parameters on/off without deleting them.
Raw mode provides a full JSON editor for the request body:
- Monaco editor with syntax highlighting
- Auto-formatting and validation
- Variable substitution (
{{variableName}}) - Full control over JSON structure
{ "name": "New Device", "displayName": "web-server-01", "preferredCollectorId": 1, "hostGroupIds": "1,2,3"}Toggle between modes using the Form / Raw JSON tabs above the body editor.
Query Parameters
Section titled “Query Parameters”Common query parameters for LogicMonitor API:
| Parameter | Description | Example |
|---|---|---|
size | Results per page | size=100 |
offset | Pagination offset | offset=0 |
filter | Filter expression | filter=displayName~"web" |
fields | Limit response fields | fields=id,displayName |
sort | Sort order | sort=+displayName |
Filter Syntax
Section titled “Filter Syntax”LogicMonitor filters use this syntax:
filter=property:valuefilter=property~"partial"filter=property>"2023-01-01"Operators:
| Operator | Meaning |
|---|---|
: | equals |
~ | contains |
!: | not equals |
> | greater than |
< | less than |
>: | greater or equal |
<: | less or equal |
Endpoint Catalog
Section titled “Endpoint Catalog”The left panel shows all available API endpoints organized by category.
Browsing Endpoints
Section titled “Browsing Endpoints”-
Use the search box to filter by path, method, or description
-
Expand categories to browse endpoints
-
Click an endpoint to load it into the request builder
Endpoint Categories
Section titled “Endpoint Categories”Endpoints are organized by resource type:
- Devices — Device management, properties, and monitoring
- Device Groups — Group operations and hierarchy
- DataSources — LogicModule management
- Alerts — Alert management and acknowledgment
- Settings — Account and portal settings
- Reports — Report generation and scheduling
Selecting an Endpoint
Section titled “Selecting an Endpoint”When you click an endpoint in the catalog:
- Method and path are populated automatically
- Example request body is generated (for POST/PUT/PATCH)
- Tab name updates to reflect the endpoint
- Previous response is cleared
Sending Requests
Section titled “Sending Requests”Execute Request
Section titled “Execute Request”Click Send Request or press Ctrl+Enter.
Request Status
Section titled “Request Status”During execution:
- Send button shows a spinner
- Status shows “Sending…”
- Progress indicator visible for long requests
Response Viewer
Section titled “Response Viewer”Response Tabs
Section titled “Response Tabs”The response viewer provides four tabs:
Collapsible, syntax-highlighted JSON tree:
- Expand/collapse nested objects and arrays
- Copy individual values
- Navigate large responses easily
Plain text response body:
- Full unformatted response
- Useful for non-JSON responses
- Search with Ctrl+F
Response headers with copy functionality:
- View all response headers
- Copy individual header values
- Check rate limit and cache headers
Generated code snippets for the current request:
| Language | Format |
|---|---|
| cURL | Command-line HTTP request |
| Python | requests library code |
| PowerShell | Invoke-RestMethod cmdlet |
| Groovy | HttpURLConnection code |
Copy snippets to use in scripts, automation, or documentation.
Response Status
Section titled “Response Status”| Section | Content |
|---|---|
| Status | HTTP status code and text |
| Time | Response duration (e.g., “234ms”) |
| Size | Response size in bytes |
Status Codes
Section titled “Status Codes”| Code | Meaning |
|---|---|
| 200 | Success – Request completed |
| 201 | Created – Resource created |
| Code | Meaning | Action |
|---|---|---|
| 400 | Bad Request | Fix request syntax |
| 401 | Unauthorized | Check session |
| 403 | Forbidden | Check permissions |
| 404 | Not Found | Check endpoint/IDs |
| 429 | Rate Limited | Wait and retry |
| Code | Meaning | Action |
|---|---|---|
| 500 | Server Error | Contact support |
| 503 | Service Unavailable | Retry later |
Pagination
Section titled “Pagination”Handling Large Results
Section titled “Handling Large Results”LogicMonitor paginates large result sets:
{ "total": 1500, "searchId": null, "items": [...], "data": null}Pagination Parameters
Section titled “Pagination Parameters”| Parameter | Description | Default |
|---|---|---|
size | Items per page | 50 |
offset | Starting position | 0 |
Fetching All Results
Section titled “Fetching All Results”To retrieve all items:
- Note the
totalcount from the first response - Calculate pages:
ceil(total / size) - Increment
offsetbysizefor each page
Example for 1500 items with size=100:
- Page 1:
offset=0 - Page 2:
offset=100 - Page 15:
offset=1400
Example Workflows
Section titled “Example Workflows”-
GET
/device/devices -
Add
size=1000parameter -
Click Send Request
-
Review device list in response
-
POST
/device/devices -
Add request body:
{"name": "hostname.example.com","displayName": "My Server","preferredCollectorId": 1,"hostGroupIds": "1"} -
Click Send Request
-
Note the returned device ID
-
PATCH
/device/devices/{id} -
Replace
{id}with device ID -
Add body:
{"customProperties": [{ "name": "environment", "value": "production" }]} -
Click Send Request
-
DELETE
/device/devices/{id} -
Replace
{id}with device ID -
Click Send Request
-
Confirm 200 response